Data Science with R & Esri (part 3)
By GBS’ Spatial Data Scientist, Phil Donovan
TLDR: Esri have now integrated R into ArcPro which brings one of the most advanced data science environments with one of the most advanced geospatial analysis environments.
R for Esri
“R? Oh, no! Not another tech tool I need to learn.”
Esri have now integrated the statistical programming language R into ArcPro. Right now you may be asking, “What is it? And why? GIS analysts already have Excel and Python. Why would they integrate yet another language and environment? And why would I want to learn R?”
The purpose of this article is to answer these questions. I want to explain why I believe that R is a fantastic tool for working with data, and the reasons that people should use it if they get the opportunity. Upfront, I just want to say that this is not an ‘R is better than Python post’, but rather a discussion and introduction to the strengths of R. Python has its own strengths and I enjoy programming in both.
What is R?
R is a statistical programming language and software environment and is one of the two most commonly used data science programming languages along with Python. R’s niche lies mainly with statisticians, data miners and academics as opposed to programmers, engineers and computer scientists who tend to use Python.
In this article I want to highlight the strengths of R and why you should consider using it, particularly if you are a geospatial analyst. But keep in mind that both languages are fantastic for working with data and there is a huge amount of crossover between the two.
Why R?
R’s principal strength derives from the fact that it is designed and built for statistics and data analysis. It was initially designed as an implementation of the S programming language which was a purpose-built statistical programming language. This contrasts with Python which was originally developed as a general-purpose programming / scripting language with data analysis and libraries and only developing more recently.
For example, the pandas Python package and principal object (data-frame) was based on R’s inbuilt native data-frame object and most of its functionality is copied across. Because of this, R provides a more mature, tested and refined approach to dealing with traditional statistical data compared to other packages such as Python. Similarly to Python, R is open-source and boasts a massive repository which is called the Comprehensive R Archive Network (CRAN), for extending the base functionality of the language. The CRAN makes it easy to develop and upload packages for other users to install and, as of September 2018, there are 15,000 packages for users to download and install.
Another strong aspect of R in recent times has been the addition of the tidyverse which has been spearheaded by Hadley Wickham. In his own words, the tidyverse is “an opinionated collection of R packages designed for data science. All packages share an underlying design philosophy, grammar, and data structures”.
Increasingly, the tidyverse covers the entire data science process as it integrates data cleaning, data mining, visualisation, modelling and, machine learning into a suite of coherent packages that are extremely intuitive and easy to use. Pertinent to GIS and its users, the tidyverse also has a geospatial extension called sf which stands for simple features.
sf is an implementation of the same formal geographic standard as implemented in by PostGIS/SQLite and Esri. ArcGIS itself. sf integrates into the tidyverse and geospatial layers can be manipulated in similar ways as regular, non-spatial data; except with added GIS functionality e.g. unions, intersections, etc. Finally, the tidyverse API has been extended so that ‘tidyverse’ code to query external data stores such as SQL databases and big data tools. Ultimately, the tidyverse makes it much easier for anyone to pick up R and get going with numerous data science tools, not just R itself. It enables new users to learn quickly and a get lot done.
In many respects, the tidyverse reflects R’s more philosophical and scientific approach to working with data and this is reflected by (a) it’s design purpose and maturity in working with data and (b), the strong association of R with academia, particularly statistics. Academics in fields such as geospatial statistics, spatial econometrics, and spatial ecologists are all developing and contributing the most cutting-edge libraries and code in R which is a key driver behind Esri’s decision to integrate R into ArcPro. This is demonstrated in this video by Esri which shows a combination of R’s vector and raster tools for analysing buffalo environments in Africa. If you’d like to know more about the tidyverse, I thoroughly recommend checking out Hadley Wickham’s free book for data science.
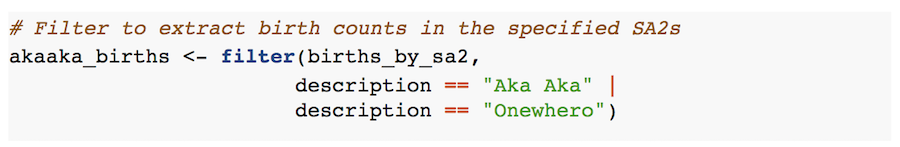
Another strength of R is its ease with which code and analysis can be documented and/or communicated. Initially beginning with RMarkdown, a user can easily create a report with both code and normal text in the same document. This article itself was originally written in RMarkdown and provided as a Word document for sharing with collegues at GBS. Here are some small code snippets which to give a taste of R and RMarkdown:
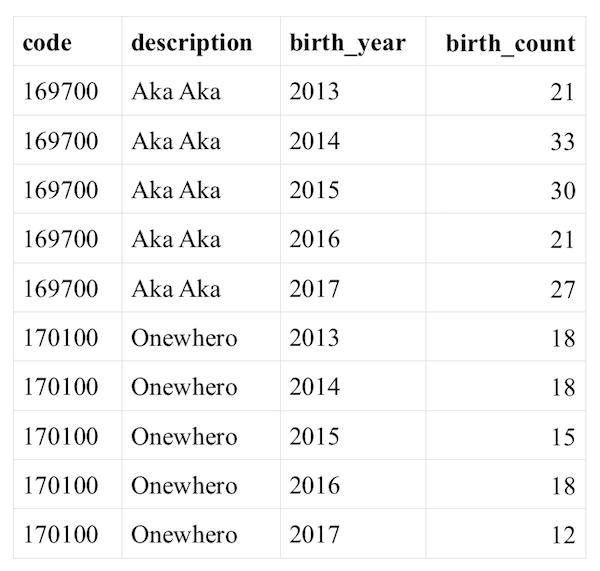
The result of the above filter is:
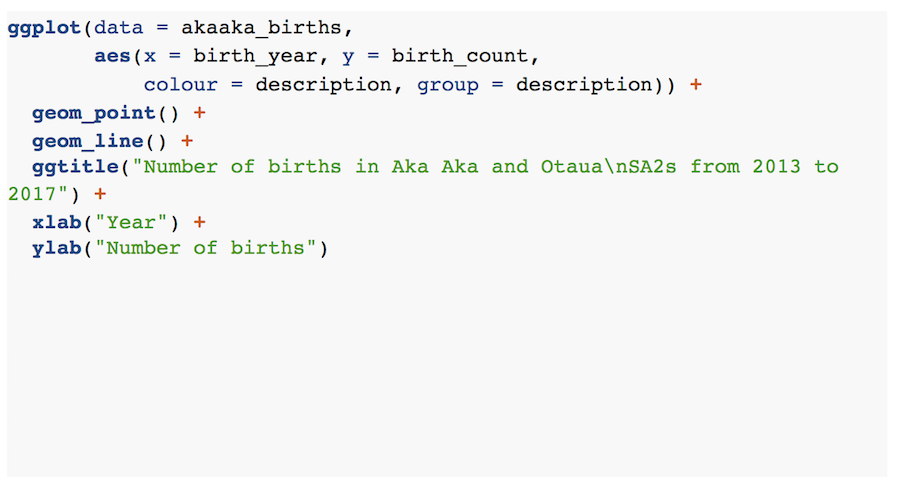
Meanwhile the code below generates a line plot in R:
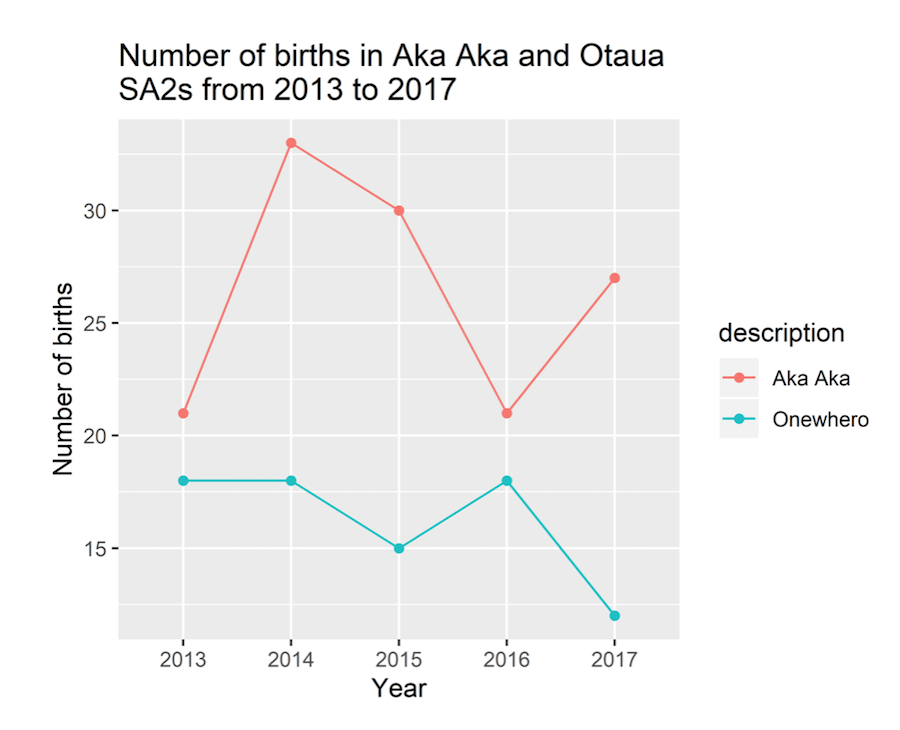
Clearly the northern river rats are outbreeding their southern counterparts! Meanwhile, the Shiny package provides a simple and easy to understand means of creating data driven web apps in R. Finally, RStudio provides an extremly simple, all-in-one environment for writing R code, creating RMarkdown documents and writing Shiny apps. The Desktop RStudio version can be downloaded for free but RStudio also provide enterprise options for businesses prepared to pay for more functionality.
The above strengths merely scratch the surface of the strengths of R, but already because of this, commercial vendors are integrating R into their systems; Esri is not the only one! Commercial support for R is increasing with Microsoft acquiring an R only company called Revolution Analytics and integrating R into SQL Server 2016, SQL Server 2017, Power BI, Azure SQL Database, Azure Cortana Intelligence, Microsoft R Server and Visual Studio 2017. Meanwhile, Oracle are integrating R into their ecosystem through ‘Oracle Machine Learning for R’. Esri themselves demonstrate R’s spatial capabilities in conjunction with ArcGIS video using the R-ArcGIS bridge for working with large spatio-temporal rasters by connecting to Microsoft Data Science custer and processing the data in parallel.
How to get going in R?
In order to get going in R, you need to install it. Firstly, navigate to the R website and select download R. This will take you to the CRAN selection page – don’t be put off by this just select the mirror(1) closest to you. Download and install the base R link, and then install Rtools as well. Rtools provide a whole set of extra R libraries and is especially useful for geospatial analysis which utilise external open-source spatial libraries.
The next step (optional) is to install RStudio Desktop. Simply navigate to the download page of their website, download and install. As discussed RStudio provides a nice development environment for interacting with R and many of its tools.
For example, if you want to install an R package such as the tidyverse, simply select Tools > Install packages and enter the packages you want.
To get going, I suggest you install the following:
- tidyverse: (actually a collection of packages) for working with data,
- sf: for tidy spatial data analysis,
- mapview: for quickly plotting sf dataframes (layers) on an interactive webmap.
Awesome, this should be enough to get playing in R!
Awesome, this should be enough to get playing in R!
To conclude – Give it a go!
R is a similar programming language to Python which is slightly more mature in analysing data and statistics. It has some advantages over Python and provides Esri users more flexibility when chosing a scripting language. It is fantastic that Esri have included R and I would thoroughly recommend any GIS analysts trying it out.
References
A list of the key tools/people and their associated websites:
- R programming language: https://en.wikipedia.org/wiki/R_(programming_language)
- pandas: https://pandas.pydata.org/
- tidyversw: https://www.tidyverse.org/
- Hadley Wickham: http://hadley.nz/
- simple features (sf): https://r-spatial.github.io/sf/articles/sf1.html,
- tidyverse with sql: https://cran.r-project.org/web/packages/dbplyr/vignettes/dbplyr.html,
- tidyverse with spark: https://spark.rstudio.com/,
- ArcGIS video on R integration: https://www.esri.com/videos/watch?videoid=lEKx_pJIKj0,
- R website: https://www.r-project.or,
- Download R: https://www.rstudio.com/products/rstudio/download/
(1) The mirrors are a bit of a hangover from the days of low internet speeds. Today, it doesn’t really matter which mirror you select.