Point of Care Testing – The where, why, and how?
The District Health Boards for Auckland, Manukau, Waitemata and Northland (Northern Region DHBs) with the support of the Northern Regional Alliance (NRA), collectively serve a community of approximately 1.9 million people of all ethnicities and socio-economic backgrounds.
DHBs are expected to show a sense of social responsibility, to foster community participation in health improvement, and to uphold the ethical and quality standards commonly expected of providers of services and public sector organisations. In line with these objectives, the Labs programme (funded by the NRA) has identified the need to improve access, especially for vulnerable communities, to laboratory services or Point-of-Care-Testing (POCT) facilities. Furthermore, there is an identified need to provide evidence-based information to assist decision-making when addressing the inequities in access to POCT facilities.
A DHB representative approached GBS with the following questions. Using an evidence-based approach, can we assist the DHB’s in:
- Identifying the best locations to establish POCT facilities, to best serve vulnerable populations and communities?
- Illustrating where locations need to service large populations, with an emphasis on Māori and those living in areas with high deprivation scores (as identified in the NZ Index of Multiple Deprivation 2018).
- Providing the ability to understand or model the cost implication to access a facility (e.g., define a maximum travel time cut-off between a facility and the customer/communities to be served).
- Providing the ability for information to be easily accessed, shared, and understood.
Our Approach
When exploring the questions with DHB representatives, we identified a Network Analysis approach as the ideal solution – specifically the optimisation models in the Location – Allocation toolset. These models choose the best candidate facilities to allocate demand in the most efficient way according to the problem type and criteria.
Location – Allocation modelling requires an analysis layer, which is a combination of three core components. For this project, those data components were defined as follows:
- Demand Points – these are point features representative of the communities or population clusters that will be accessing a service or facility. We used the census meshblock layer to create the most accurate representation of geographic locations for population clusters and combined this with ethnicity data and deprivation index data, before converting to a point feature input. There are just under 10000 demand points for the study area.
- Facilities (Candidate and Required) – also point features, this model differentiates between required facilities (existing hospitals, labtest facilities) already providing services, and candidate facilities (facilities that could be considered as POCT locations) such as GP practices, maraes, or schools (the list of candidate facilities was compiled and formalised through collaboration between DHB’s and GBS). There is a combined total of just under 1000 candidate and required facilities for the study area.
- Network Layer (Transportation Network) – This is not a traditional line feature input, but an intelligent network that incorporates connectivity between features (intersections, overpass, underpass, speed limits, access restrictions, road surface, road hierarchy, ferry links, etc.). This enables the model to calculate the cost to travel (impedance), such as travel time or distance (routed distance rather than straight line) between demand points and facilities accurately. GBS selected the Premium Road Network layer provided by Esri.
Modelling Reality
Once the Location – Allocation approach had been approved, and analysis layer had been defined and compiled, GBS and DHB’s engaged in several collaborative workshops to formulate scenarios to test in the model – an example follows:
“A 2-year-old with a urea cycle defect, gets frequent hyperammonaemia crises. She lives in Cape Reinga, approx. 1.5 hours from the closest hospital in Kaitaia. She needs frequent monitoring of ammonia (by a health professional) but with a single parent and several young siblings, it is difficult for her mother to take her to Kaitaia hospital.”
Options for POCT for ammonia testing:
-
-
-
- Mobile vehicle/van: daily to weekly; roads; where would vehicle be based?
- A node/candidate facility: GP surgery, pharmacy, school.
-
-
For this example, we identified travel time as the primary factor in locating candidate facilities, as regardless of specific medical condition, a commute of 1.5hrs was considered unacceptable. We also wanted to identify potential locations for mobile clinic stop-overs. So, we selected a Location – Allocation model called ‘Minimize Facilities’ and agreed on an impedance value or travel-time limit of 20 minutes (one-way).
This model (illustrated below) attempts to identify the minimum number of facilities needed, such that as many demand points as possible are allocated within 20 minutes driving time of a facility.
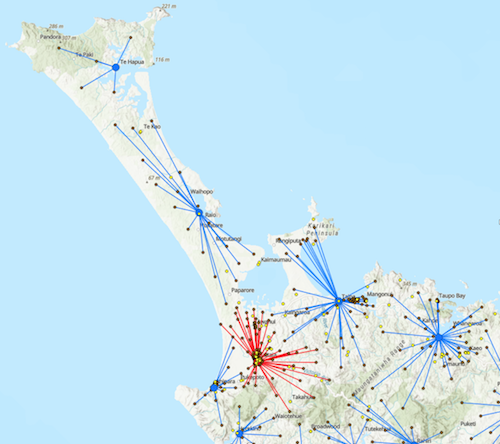
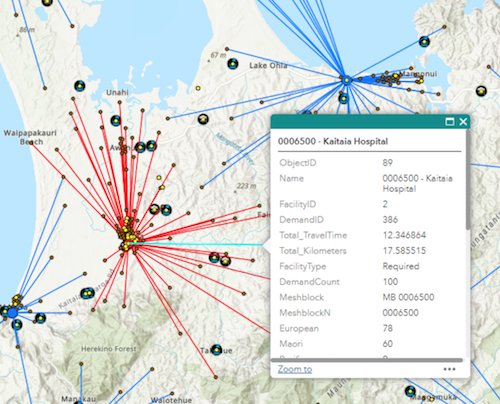
Red point represents existing POCT facilities/service providers (in this example Kaitaia Hospital) and the assigned (red lines) Demand Points (brown points) within 20min drive time.
Blue points represent candidate facilities identified as being in a prime geographic location to provide services to the assigned (blue lines) Demand Points within 20min drive time.
How do we use it?
The output of the model is used as a guide to identify candidate facilities that occupy optimal geographic locations based on specific model parameters. Thus, decision makers have the flexibility to consider any number of additional options for a selected location. As the output retains the values of the input data, users are able to query by attributes such as the total population that is allocated to a candidate and decide whether the location meets criteria to be funded as a permanent facility or as a host facility for a scheduled mobile clinic. Since the output is geographically referenced it can be viewed and compared to other spatial data… But our client does not have access to a mapping application.
How do we share it?
GBS facilitated the setup of an AGOL account for the POCT project team and have created a web app for users to view, query and share the data online.
To facilitate decision makers even further, we have expanded the Web App to include all the raw data layers that were used to compile the analysis layer, as well as additional reference layers for comparison with model output. This gives users greater flexibility when choosing preferred facilities at a location to meet cultural preferences (using a marae as a mobile clinic host rather than the school identified by the model across the road), religious preferences, and budget implications etc.
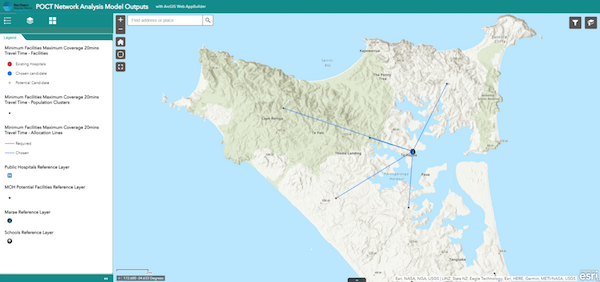
Figure 2.POCT Web App, Cape Reinga example showing all Demand Points within 20min of Candidate Facility. The facility chosen is a school, however users can view additional facilities in close proximity (a marae in this example) and select by preference.
Where to next?
The next few weeks and months will see further collaboration between GBS and DHB representatives to formulate the final model scenarios. Demo data will be replaced with final model output and attribute tables will be decluttered. Several additional DHB specialist units have identified the value in the project and have joined in the discussions. We trust this will be a longstanding collaboration to benefit many communities in the near future.